


Metabolite Annotation Summary Sheet
Analyte Information
The metabolite annotation summary with the hyperlink (clickable) to the Box Plot Data Sheet showing the relevant experimental details and statistics for each detected metabolite.
The KEGG ID column provides a click-on button which enables a direct entry into the open access Kegg Database System (Kyoto Encyclopedia of Genes and Genomes).
Statistical Tests and Classification Methods
Statistical tests and classification methods are employed for the assessment of the processed metabolomic data.
The used statistical tests (Fold Change, T-Test) focus on whether there is a difference between the studied groups (either treatment, target (TT) / control, wild type (CL, WT) group or the pairs of the treated samples.
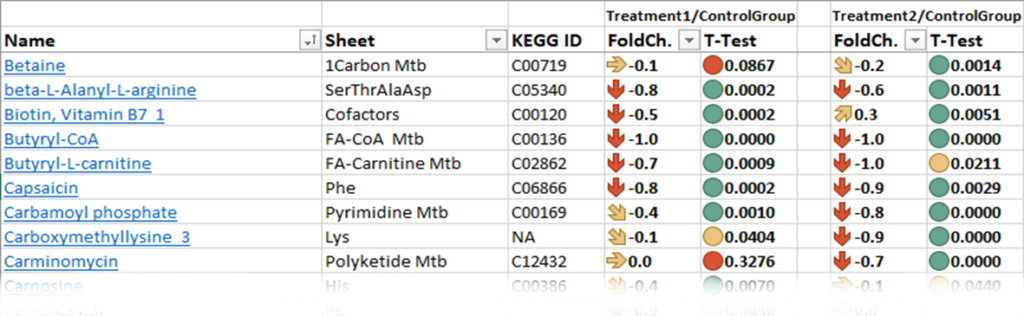
Fold Change values for each compared group and its statistical significance (with outliers) is an integral part of the sheet.
The reported annotated metabolites can further be sorted and classified by means of the common Excel tools; for instance, alphabetically (for the metabolite sorting), the CTRL F word search, according to the FoldChange values etc.
It is not recommended to change the names of sheets and metabolites due to the usage of hyperlinks in the Data Analysis Document.
The Fold Change column indicates a change in each metabolite pair data set.
T-Test shows credibility (a statistical significance of this change).
The T-Test values remain hidden for simplicity and clarity. Nevertheless, the exact values can be viewed after the selection of a specific cell if needed.

Statistical Data Test Sheet
Fold Change (FC)
describes a quantitative change between the original, (control (CL), wild type (WT) and a subsequent variant (treatment) measurement. The formula is therefore defined as:
B/A – 1 (Treatment / ControlGroup – 1). It is visualized by 5 arrows of 3 colours:
↑ A statistically significant increase (>50% change)
↗↘→ A mild increase/decrease (10-50% change) or no-change
↓ A significant decrease (>50% change)
In the field of omics science and more generally in bioinformatics, the modern usage is to define fold change in terms of ratios on linear or logarithmic scale. Log-ratios are very often used for analysis and visualization of the fold changes.
For instance, a change from 40 to 20 would be a fold change of -0.5, while a change from 20 to 40 would be a fold change of 1 (a change of 2 times the original).
The logarithm to base 2 (Log2FoldCh) is most commonly used as it is easy to interpret, e.g. a doubling in the original scaling is equal to a log2 fold change of 1, a quadrupling is equal to a log2 fold change of 2 and so on. Conversely, the measure is symmetric when the change decreases by an equivalent amount e.g. a halving is equal to a log2 fold change of −1, a quartering is equal to a log2 fold change of −2 and so on.
T-Test
is any statistical hypothesis test in which the test statistic follows a Student’s t-distribution under the null hypothesis. It tells us if there is a significant difference between the means of two groups. A two-sample unequal variance test with symmetrical (t) distribution (the Welch´s test) is used.
The T-test is visualized by means of three colored circles:
Threshold of statistical significance < 0.01 (or 1%) – very significant
Threshold of statistical significance < 0.05 (or 5%) – likely significant
Below threshold of 0.5 (or 5%) – statistically not significant

Clasification methods – Volcano Plot Data Sheet
Volcano Plots
The Volcano plot separates and displays the measured variables into two groups – upregulated and downregulated. It is a type of scatter-plot that is used to quickly iden-tify changes in large data sets composed of replicated data. It shows significance versus fold-change on the y and x axis, respectively. It displays unstandardized signal (here log2-fold-change) against the noise-adjusted/standardized signal (log10 (p-value) from the t-test).
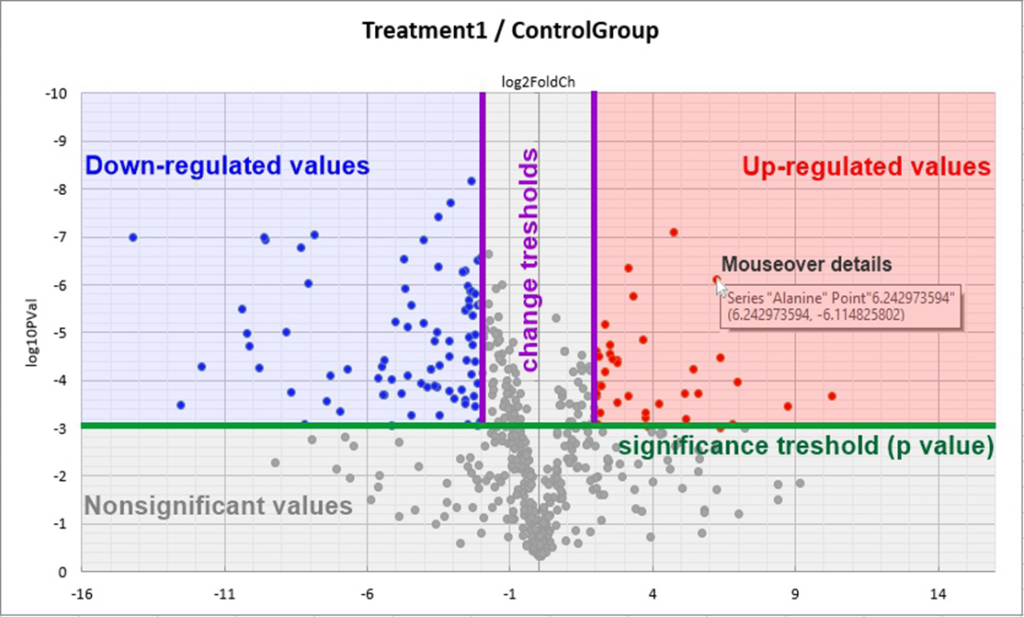
- A higher number of the studied groups requires multiple comparisons. In such case, a corresponding number of charts number is annotated.
- The maximum number of analytes displayed in one chart is 250. If this number is higher, the additional analytes are shown in subsequent charts.

Classification Methods – Box Plot Data
KEGG and HMDB
KEGG (Kyoto Encyclopedia of Genes and Genomes) and Human Metabolome Database (HMDB) are free online databases where it is possible to find descriptions (and purposes) of metabolites in more detail. Blue ID numbersare clickable leading to a specific website.
Raw data
An annotated summary of the retention time [min], exact mass [Daltons to four decimal places] and the unsmoothed integrated ESI HRMS peak signal of each analyte in a single analytical run, either unscaled = “linear” or on a logarithmic scale)
Detection noise threshold
A MS signal peak area value of an analyte arbitrarily set-up to “5000” for very small MS signals or for those not detected is a particular sample. It is gap filling operand.
Box Plot(box and whisker plot)
Statistical visualization of each analyte in dataset shows a peak area MS signal, a minimum, Q1, median, Q3, the maximum value and p-value.
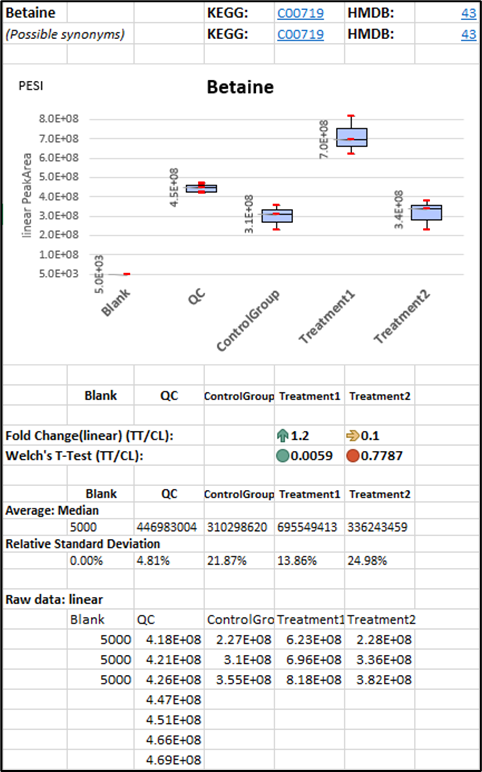
Blank Sample (BL)
Blank sample means a sample processed without the biological matrix. It is used
QC Sample (QC)
A pooled sample consists of an equal aliquot of each sample involved in the study. It is measured repeatedly during the metabolomic study. The MS signal RSD values stand for a variance of the instrument measurement. The RSD values obtained by analysis of the Control and Treated group show the biological variance.
Control sample (CL)
It is an optional sample to which all others relate and to which they are statistically compared. It can be wild type or otherwise untreated or “point zero”.
Target (Treatment) sample (TT)
Fold Change and T-Test show the difference between the two compared groups, in this case between the Treatment (TT) vs Control (CL) Group. The median and RSD values indicate the data homogeneity.
RSD
stands for the relative standard deviation and is also known as the coefficient of variance (CV). The RSD estimates the precision of the average of the measured results. For instance, an average value of 100 with a RSD of 6% means that the vast majority of results falls between 94 and 106, i.e. AVG 100 +/- 6%. The smaller the calculated relative standard deviation is, the more precise the measurement is.In nontargeted metabolomic analysis, the acceptable measurement precision can be set-up arbitrarily, for instance the RSD = 15, 20, 33 % or up to 50 % are most common.